With Beonder Monitor you gain insights like never before
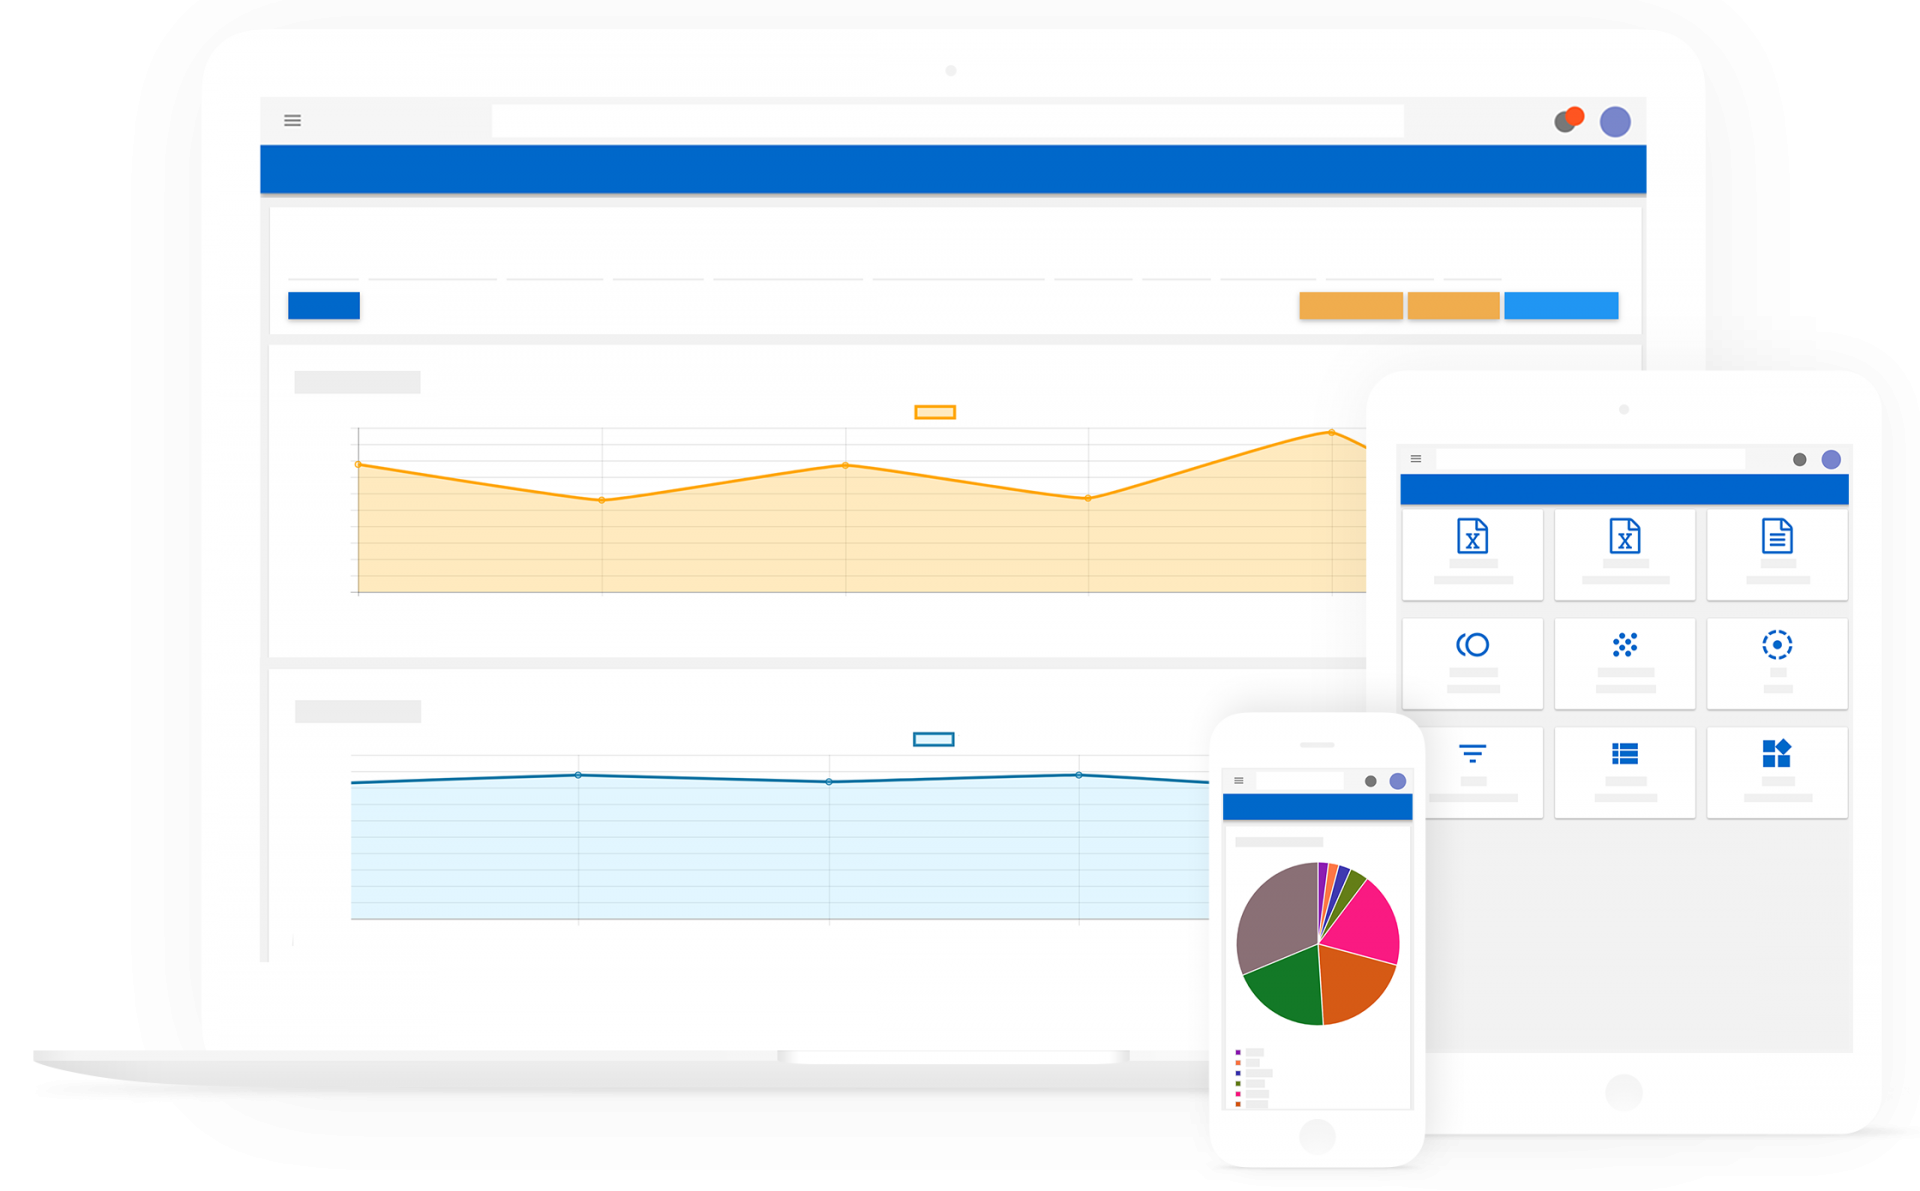
All data stored in one dashboard
Easy-to-use tool for data visualization and reporting
Gratis proefperiodeBeonder Monitor helps you to extract valuable information from large datasets on an easy to use data dashboard. By storing data centrally, colleagues can retrieve and share information at any time. The system performs analyzes and provides insight into all KPI’s to ensure the future of your organization.
- Data visualization Visualize relevant data in a well-organized manner for your customers and colleagues.
- Improved insights Use Beonder Monitor for strategic and tactical business processes.
- Share knowledge Share knowledge efficiently by storing data centrally.
- Automatic reports Generate automatic reports and save a lot of time.
- Easy to use Set up Beonder Monitor according to your own business goals.
compare_arrows
Collect data
Easily add and edit data by using file formats such as .csv and .xlsx.
search
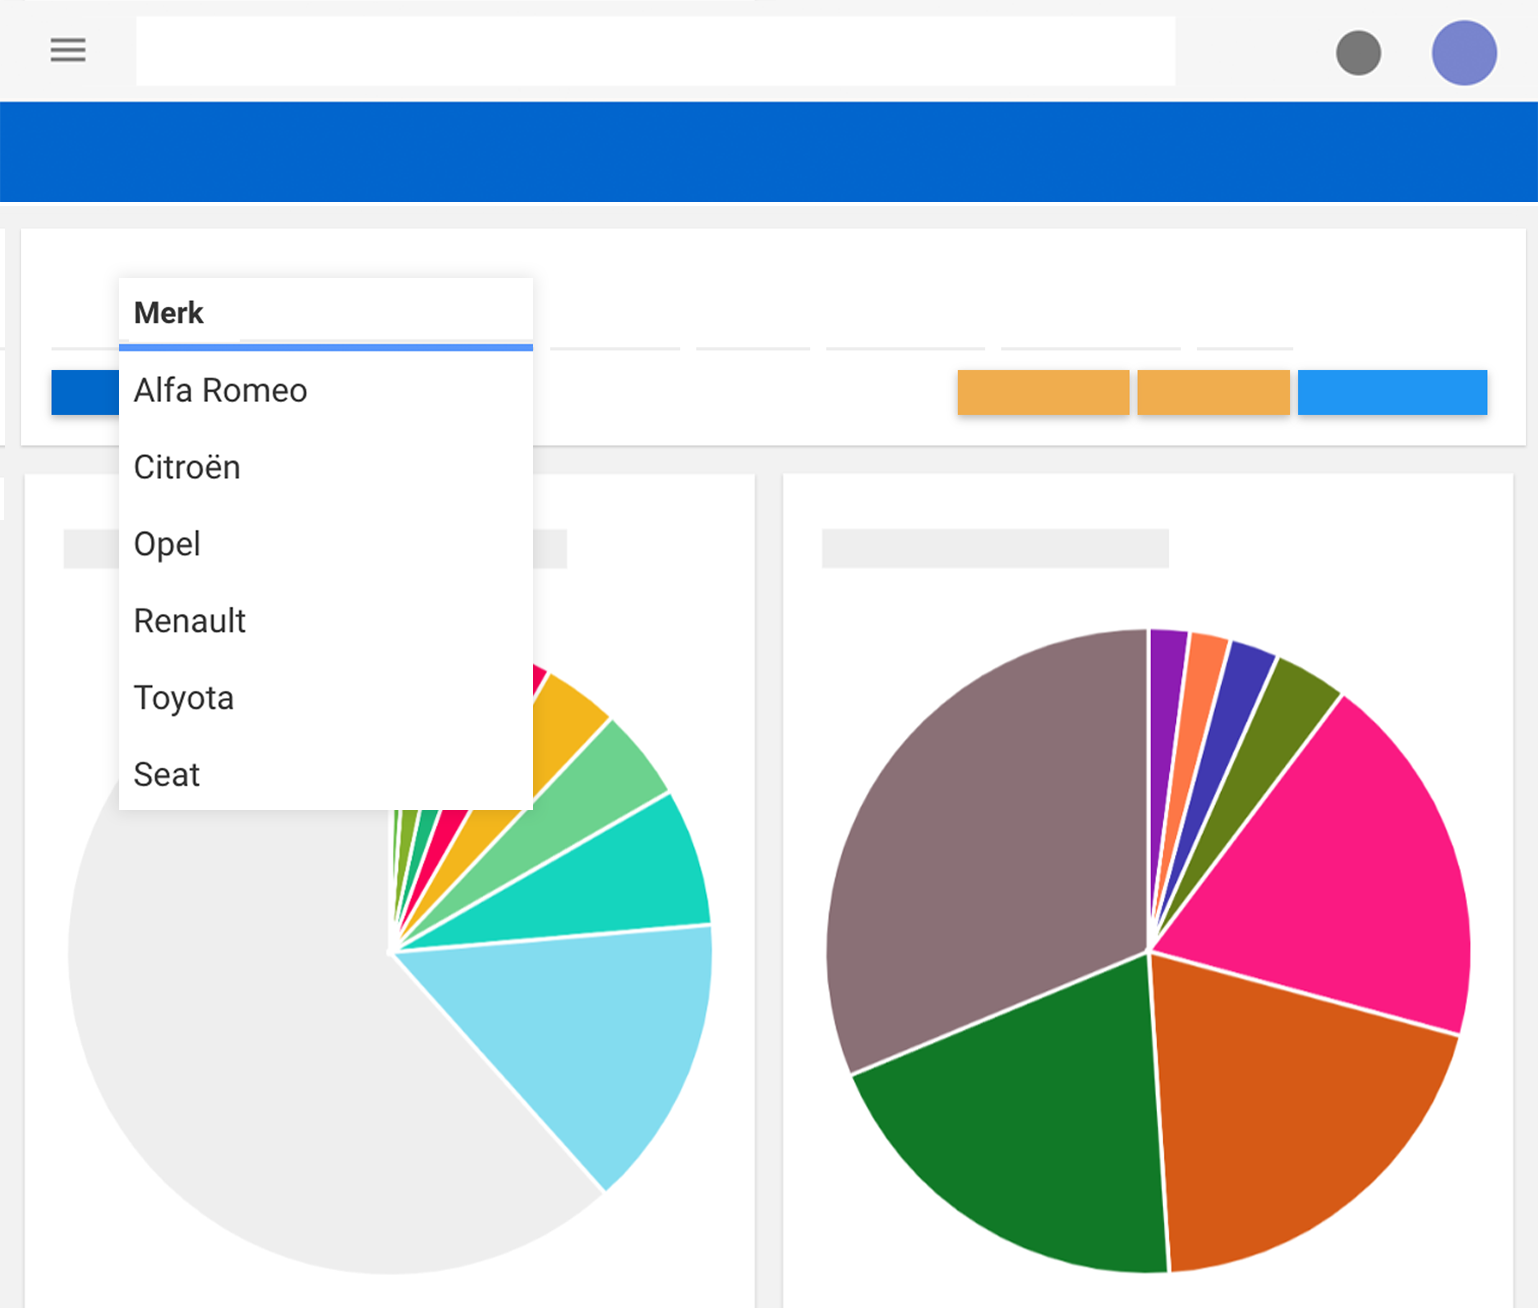
Examine
Use different functions to examine and organize relevant data. Filter by category.
show_chart
Present the results
A visual representation of data in one dashboard. Setup the dashboard to present your data in a well-organized manner.
Important data immediately accessible for your management team
Present data in a clear way
Calculate data by using spreadsheets and display the information with your own report templates. Get a quick view of your performance by using different export options.
scatter_plot
Easy access to KPI’s
Use different reporting modules to analyse all of your Key Performance Indicators
bar_chart
Benchmark and compare
Perform a benchmark analysis between different data sets.
multiline_chart
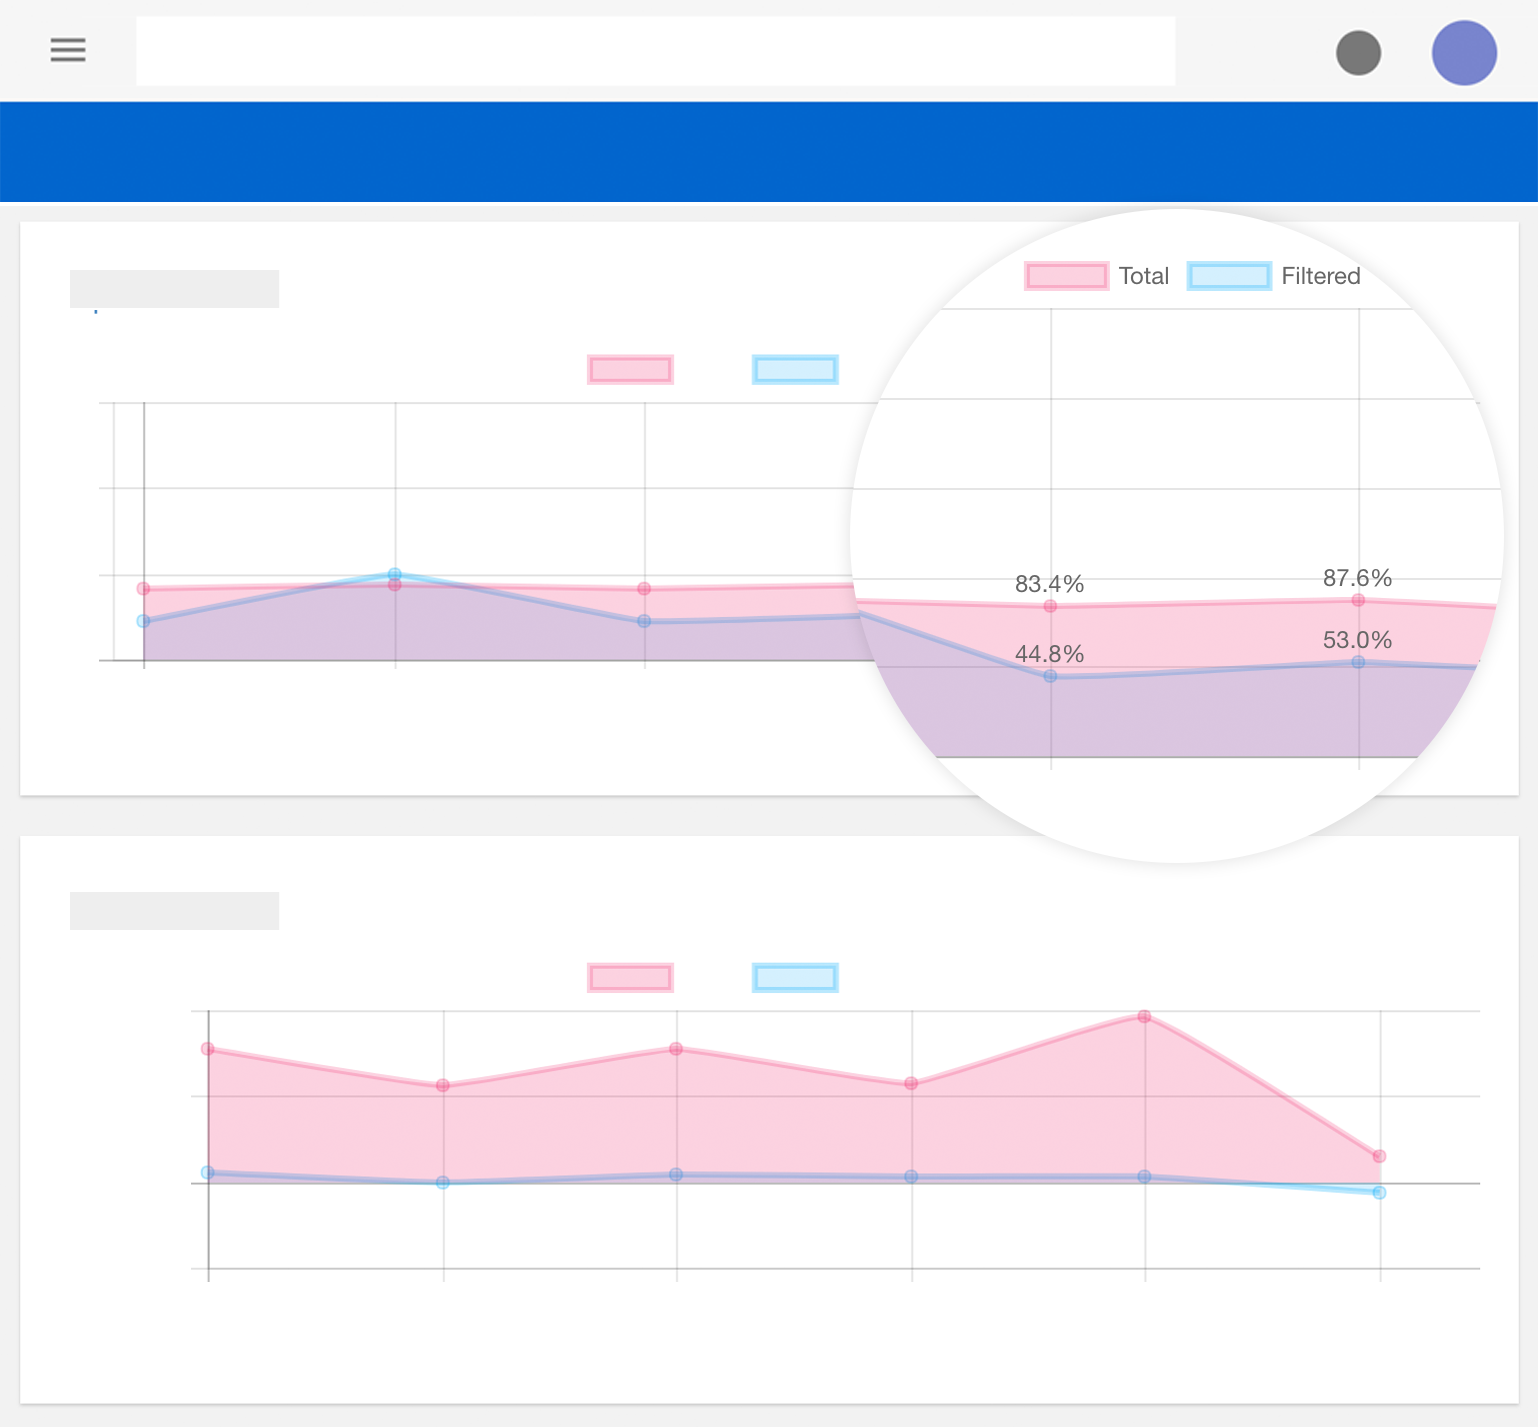
Discover trends
Compare the results of the analysis and discover new trends.
All valuable data stored in one place
Sort valuable data with custom filters. Use a hierarchical layout of widgets to make detailed information accessible. Determine the focus area by selecting different data sets. You can view all overviews via the navigation structure.
playlist_add
Periodic data
Use periodic data to define trends.
developer_board
Perform calculations
Perform calculations with spreadsheets. Large data sets are quickly converted into new insights.
insert_chart
Graphs and filter options
Set charts on the dashboard, view details and use powerful filters.
format_quote
We always have quick access to our data with an easy-to-manage system
Wouter Spelters